by Konrad Mugglestone and Michael Dannenberg
While testifying before a special joint legislative commission in Louisiana this morning, Education Reform Now’s Michael Dannenberg recommended the state adopt an altered method of measuring merit in awarding state student financial aid. The method combines assessments of need and academic performance. We call it ‘earned aid’ much like the Earned Income Tax Credit. Design details appear below.
Conceptually, the “Earned Aid” Scholarship Formula is designed to provide a scaled score that prioritizes the distribution of grant aid according to a nuanced assessment of achievement as measured in the context of family income. The formula is designed such that there is a multiplier that captures and incentivizes academic performance with an exponentially increasing weight based on family income. With regard to the merit versus need-based aid debate, we hold this is a justifiable, compromise student aid model, because it guarantees some scholarship aid to high achieving students at all income levels while also guaranteeing at least some financial aid to economically disadvantaged students at all achievement levels.
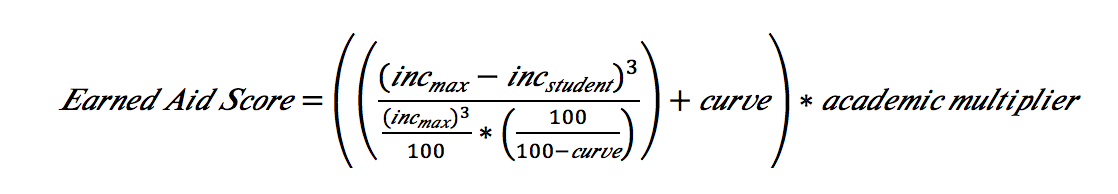
Where:
- incmax = the maximum allowed income to be eligible for scholarship funding, in thousands.
- incstudent = the household income of the student, in thousands, rounded up to the nearest thousand.
- curve = a value between 1-100 that allows for changing prioritization of resources based on income. This determines the minimum score a high performing, high income student with an income at the incmax will receive. The decision on where this value falls should be made with the recognition that higher curve values generally benefit wealthier individuals at the expense of poorer individuals.
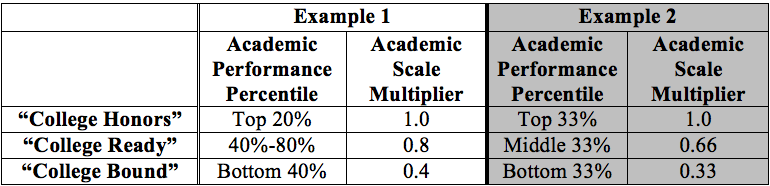
- academic multiplier = an academic performance metric that can be determined by the scholarship provider. We recommend breaking the population into achievement percentiles (i.e.: top 20%, middle 40% – 80%, bottom 40%). A multiplier is set to the reflect the level of performance merited. While the high achieving students should always be given full credit, higher multipliers for lower performance individuals will allow larger portions of low-performing students to have access to scholarship resources. Below are examples of potential scaled multipliers:
Breaking down this formula further, we first calculate the difference between the income of the student and the maximum income allowed for scholarship eligibility, which will produce large values for low-income students and smaller values for high-income students. This value is then exponentially raised to produce a curve that will increasingly benefit low and middle-income individuals.
Second, we divide the numerator by a maximum value (incmax exponentially raised) divided by 100 and multiply it by a scaling value designed to guarantee that a high performing student with zero income — once the scaling value is added on top — will score a perfect 100 on the income component, and a high performing student from a family earning near the max income value, will score a base non-zero value. Put another way, once the academic multipliers are applied, it guarantees that a high performing student, regardless of income, has a decent minimum score.
After the earned aid scores have been calculated, we recommend rescaling the scores such that the minimum score to be eligible for scholarships is the curve value and the minimum score for full scholarship funding is the score given to low-income, high achievement and medium-achievement students. The minimum score for any scholarship funding is the curve value, or what a high-achieving student from a household earning near incmax would receive as a score.
This “earned aid” formula is “dialable.” Below are examples of the impact of changes to different variables.
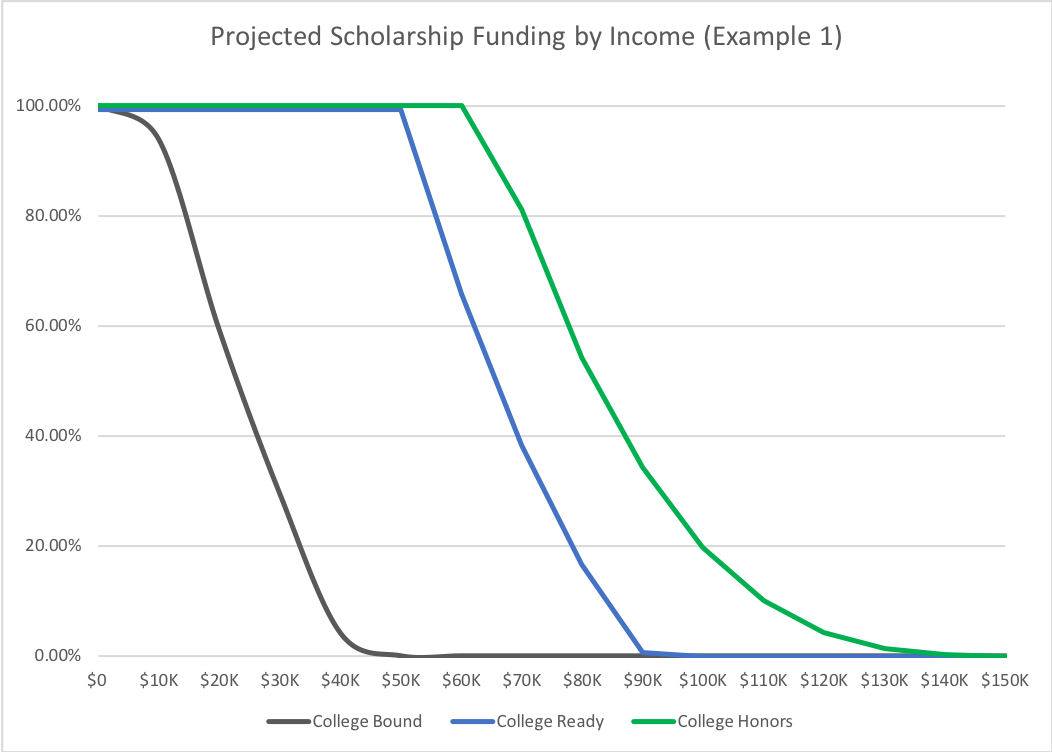
Example 1: Imagine a state that has relatively even distribution of incomes, where policymakers set the maximum limit of income eligible for a scholarship at $150,000, low-income is deemed to be $0-$50,000, middle-income is $50,000-$100,000, and upper-income is $100,000+. They decide to set their baseline score at 20, which results in the chart for their scores below. Aid caps out at the $150,000 income level.
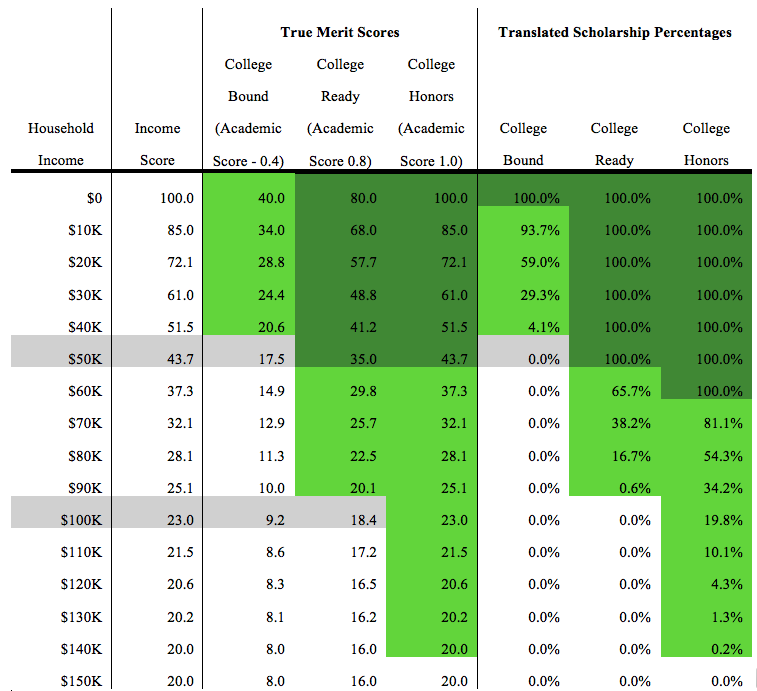
As one can see, the minimum score to get some scholarship funding would be 20.01, or the curve value, and the minimum cutoff for guaranteed funding is 41.24 – the score given to a student who falls in the low-income category but has medium academic achievement. Scaling the remaining scores in-between nets proposed scholarship funding levels for the remainders. Note, for simplicity, these examples were calculated with $10,000 as the increment. In execution, the formula would be calculated per thousand dollars of household income, netting a far more nuanced and smooth scale.
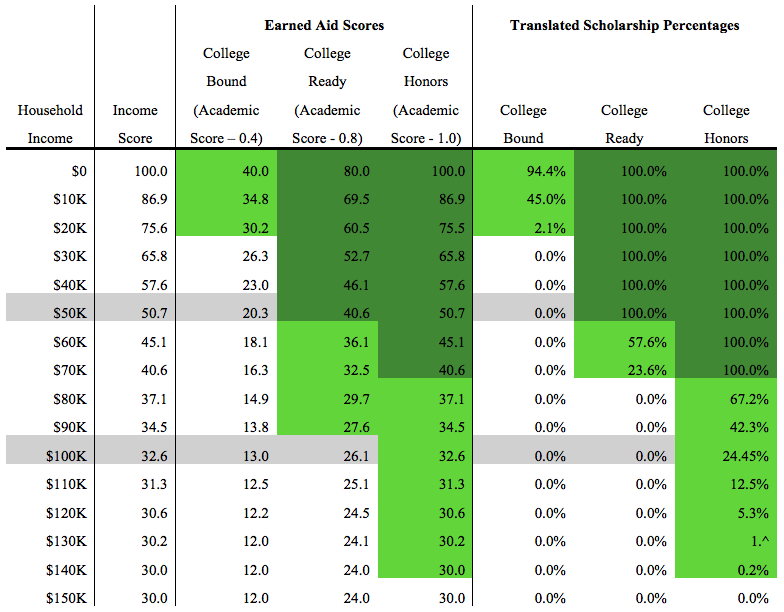
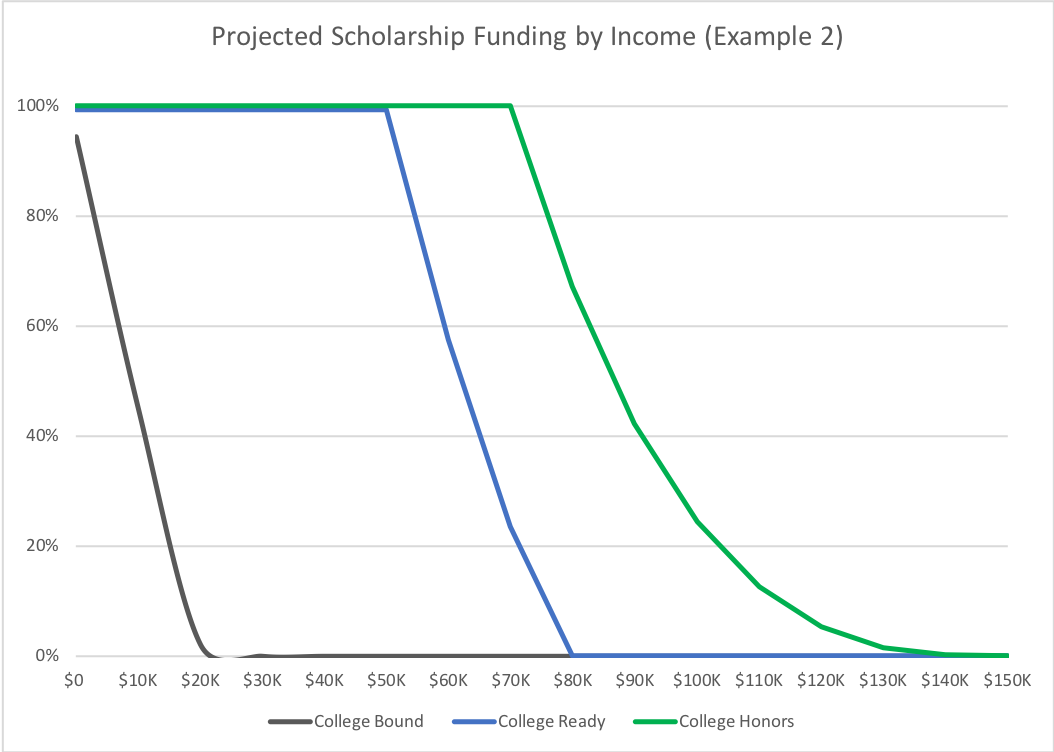
Example 2: In this example, the same state chooses to increase the income curve value to 30, instead of 20. In the chart below, one can see it nets a result that is more beneficial to higher income students, while reducing the likelihood for a low-income, low-achievement, individual of getting scholarship funding. Such a table would look like this:
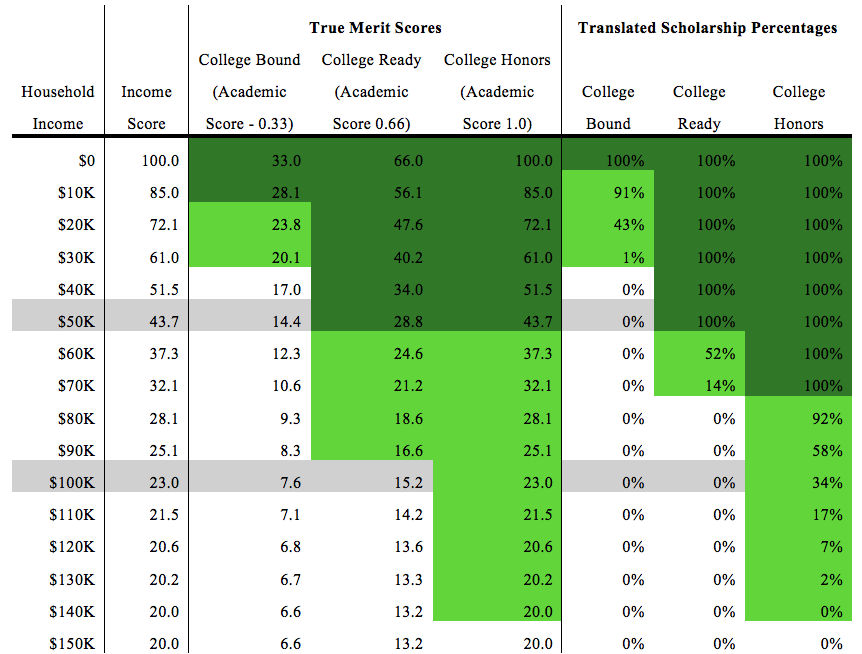
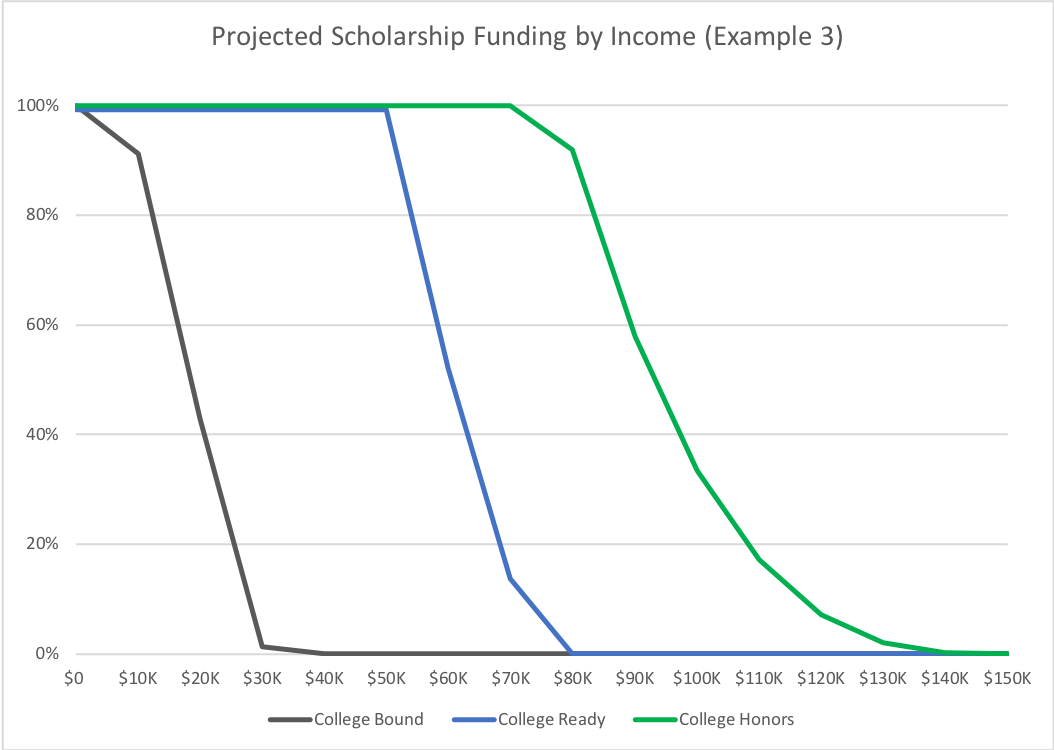
Example 3: Finally, to illustrate the impact of the academic multiplier, in this example, the state changes the academic multipliers to .33, .66. and 1.0, as per the second example listed in Table 1. In this instance, because the low- and middle-achievement thresholds are lower and smaller, there are fewer income levels provided with financial support. On the other hand, at high achievement levels, more income levels are provided will full scholarship support.
Conclusion
As states contend with constricting budgetary shortfalls, there are compelling arguments for prioritizing limited financial aid towards those with the greatest need, or those with the highest academic performance. On one hand, policymakers need to balance the reality that economically disadvantaged individuals are less likely to be able to grapple with high college costs, and thus are denied access to the education they need to improve their economic fortunes. On the other hand, policymakers may be tempted to put those limited dollars towards helping the students who are most likely to succeed, due to a prior record of academic success.
With the application of this formula, policy makers do not need to choose one hand or the other. This concept represents a customizable compromise solution that balances and rewards both academic merit and financial need. Based on the priorities of a state, policymakers can choose academic multipliers or need-based curves to emphasize merit or need more in their calculations, but the formula will still always guarantee some resources to the highest achievers, as well as the most economically disadvantaged. Furthermore, it prioritizes resources to the best investment of all – economically disadvantaged high achievers – the individuals who will see the greatest return on investment for themselves and for the state.