Last month, the National Center for Education Statistics (NCES) released their annual report on the Condition of Education for 2024. The report provides a uniquely comprehensive statistical overview of education in the United States This year’s report sheds light on several critical areas, including graduation rates and national assessment scores in reading and mathematics. What particularly stands out to us are the conflicting signals sent out by the increase of the former and the decline of the latter.
Big Picture on Achievement Trends
- Reading and Mathematics Assessment Scores Show Long-Term Improvement Since the 1970s, But Recent Trends Show Mixed Results
- Achievement Gaps Have Narrowed, But Disparities for Students of Color Remain Despite Recent Progress
- High School Graduation Rates Have Increased Between 2012 and 2020
Reading and Mathematics Assessment Scores Show Long-Term Improvement Since the 1970s, But Recent Trends Show Mixed Results
Overall Trends. From the 1970s to the present, NAEP data shows overall improvements in reading and mathematics scores for both 9 and 13 year olds. For 9 year olds, reading scores improved by 12 points, and mathematics scores increased by 23 points. However, NAEP scores have generally declined since about 2010 and that decline accelerated subsequent to the pandemic (see trend graph below for 13 year-old NAEP scores).
In the 2022–23 school year,the first post-pandemic year for which we have such data, NAEP’s long-term trend (LTT) assessments revealed that average scores for 13 year olds declined by 4 points in reading and 9 points in mathematics compared with 2019–20.This marks the steepest decline in NAEP scores in history, highlighting the severe impact of pandemic-related disruptions on student learning and achievement.
Trends for Different Racial/Ethnic Groups. When examining different racial and ethnic groups, there are both encouraging signs and areas for concern. Black and Hispanic students have made significant progress in both reading and mathematics, narrowing the gap with their White peers, who have also made gains. For instance, Black 13 year olds increased their reading scores by 22 points from 1971 to 2022, reducing the gap with White students from 39 points to 24 points. Similarly, Hispanic 13 year olds improved their reading scores by 18 points from 1975 to 2022, narrowing the gap from 30 points to 19 points. In mathematics, Black and Hispanic 13 year olds showed even greater gains—27 and 29 points respectively since 1978—compared to a 19-point gain for White students. This is an ideal public policy outcome: all groups gaining and gaps narrowing.
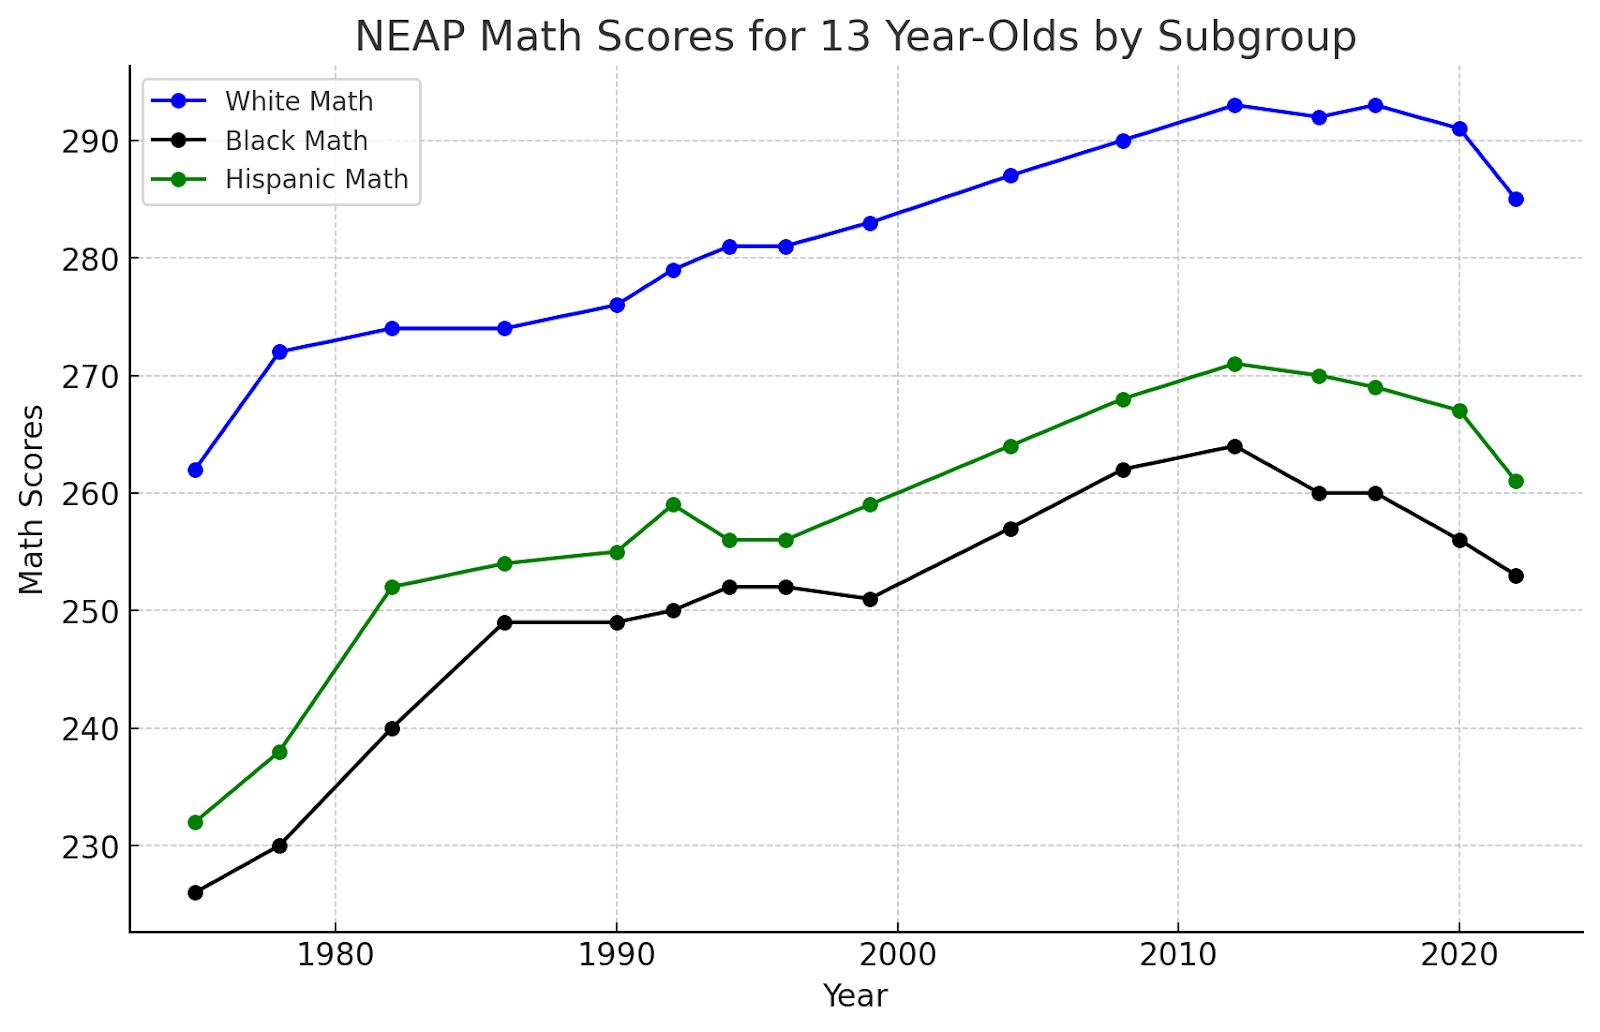
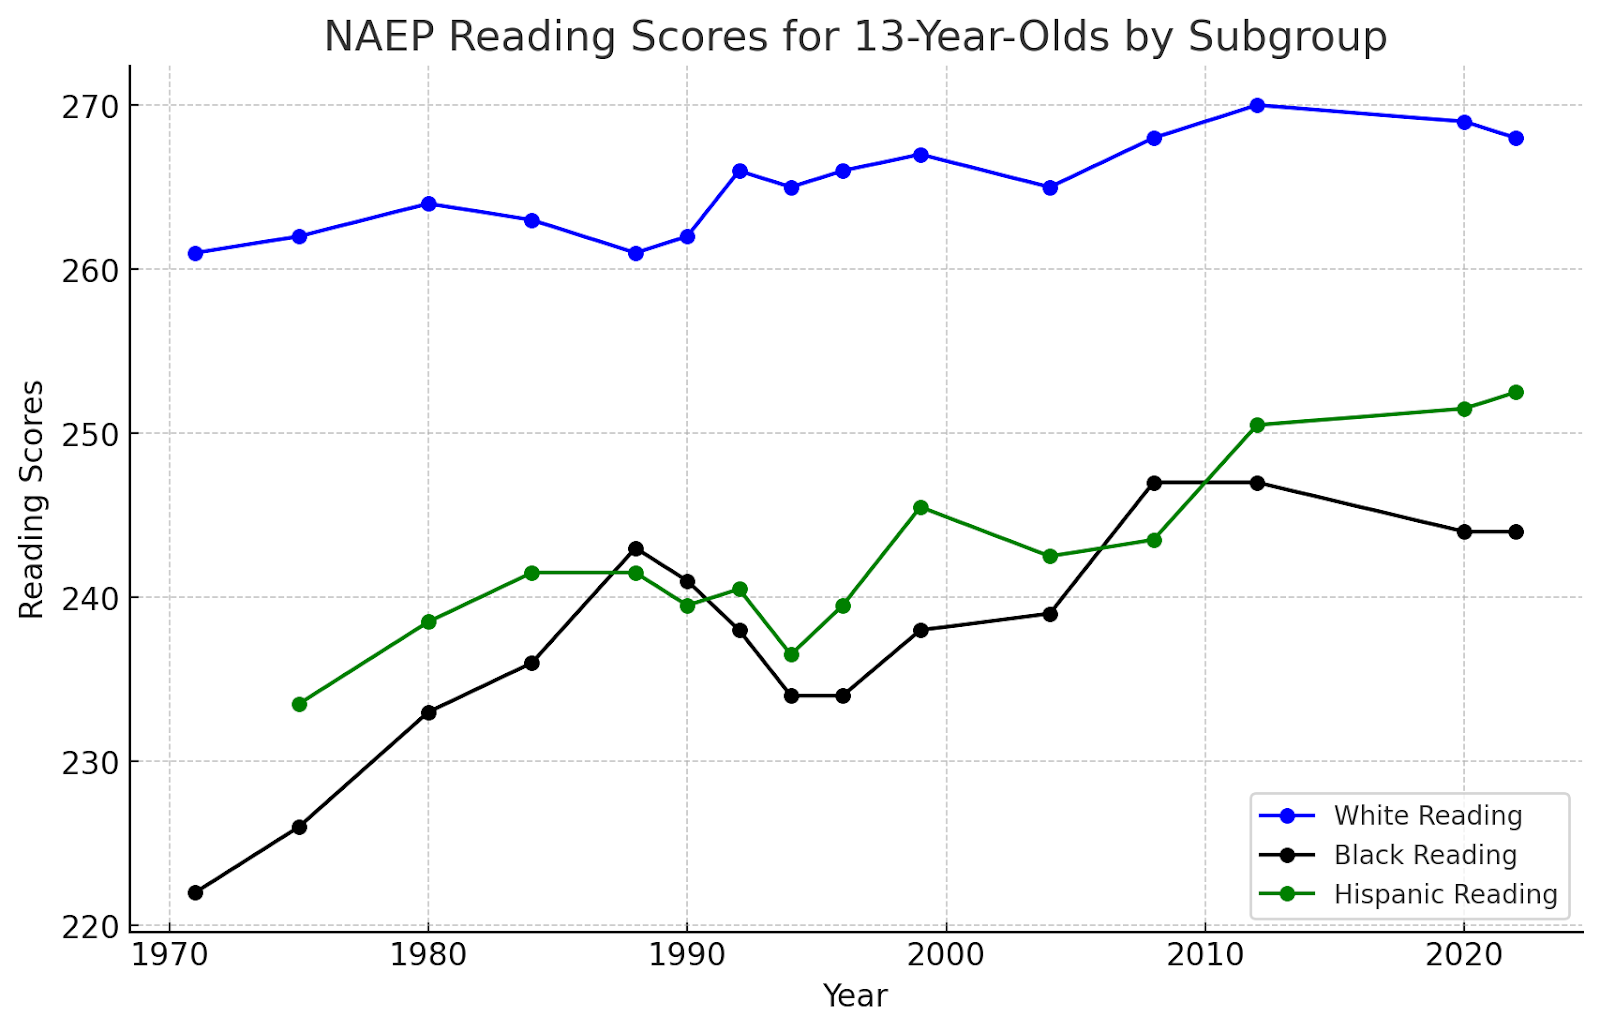
However, some gaps have widened again in recent years, especially in mathematics. Before the pandemic, math scores for Black 13 year olds showed slow progress, despite remaining relatively stable from 2015 to 2020. However, after the pandemic (21-22) math scores for Black 13 year olds dropped by 7 points while math scores for White students dropped by 6 points. In reading, the scores did not decline as significantly across all subgroups as compared to mathematics.
While there’s no comparable achievement data for high school students in the Condition of Education, we do know that a previous NCES report reported that in 2019 “the high school graduates who attained a midlevel curriculum had lower average NAEP mathematics assessment scores than either 2005 or 2009 graduates.” Additionally, a 2022 School Pulse survey found a higher proportion of high school students “below grade level” (subjects not specified) than in 2019, at 37% v. 46%, respectively.
High School Graduation Rates Have Increased Between 2012 and 2020
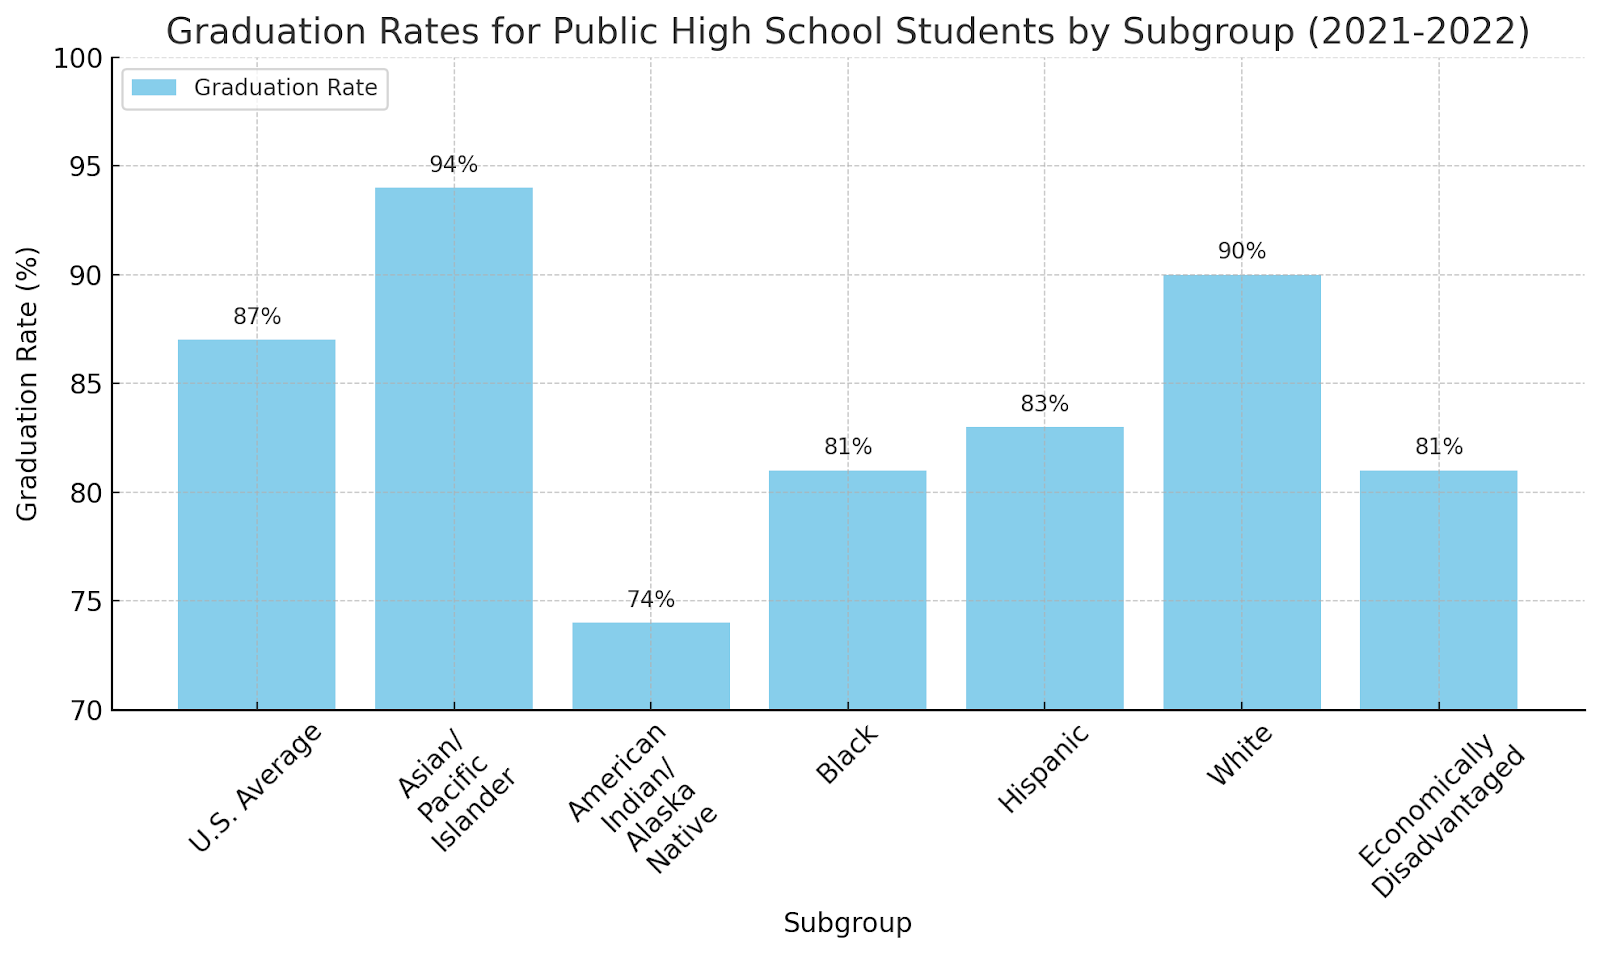
The national average adjusted cohort graduation rate (ACGR) for public high school students rose from 80% in the 2011–12 school year to 87% in 2021–22. Notably, the highest graduation rates were observed among Asian/Pacific Islander (94%) and White (90%) students. Despite overall progress, disparities persist among students of color and those from low-income backgrounds. In the 2021–22 school year, the ACGR for Black students was 81%, and 83% for Hispanic students. American Indian/Alaska Native students had the lowest graduation rate at 74%. Additionally, economically disadvantaged students and those with disabilities had ACGRs of 81% and 71% respectively.
Conflicting Trends in High School Graduation and Student Achievement
It has to be noted that we are seeing a somewhat paradoxical pattern of outcomes: student achievement at all grade levels, with a few exceptions, began to plateau or fall after 2010 and continued to decline post-pandemic. Conversely, high school graduation rates are up.
While no single data point is definitive, a key question emerges from these trends: If achievement is down and graduation rates are up, are students graduating high school without building foundational mathematics and literacy skills?
That’s a possibility. While graduation rates began to tick up after 2010, many states relaxed their graduation standards post-pandemic to maintain steady graduation rates. These changes included easing credit, testing, and attendance requirements. This may account for the fact that graduation rates, unlike test scores, did not decline over the course of the pandemic.
We also know there has been significant grade inflation, especially in high school, over the entire span of more than decade-long increases in graduation rates. According to Education Week:
“Between 2010 and 2022, [high school] student GPAs climbed markedly. According to the ACT study, the average adjusted GPA increased from 3.17 to 3.39 in English and from 3.02 to 3.32 in math. In 2022, more than 89 percent of high schoolers received an A or a B in math, English, social studies, and science.”
It’s possible that student achievement is actually increasing in a way that is reflected in grades but not in NAEP scores. Alternatively, it’s also possible that we’re pushing students through to graduation without ensuring fundamental academic proficiency and that this, in turn, sets them up for failure. But it’s far too early to tell. The trends in high school achievement and graduation haven’t really had time to fully play out in college admission, remediation, and completion or in the job market. These are all trends that are worth watching in the coming years,
The lack of clear answers about the conflicting trends of declining achievement rates and upticks in graduation rates doesn’t mean that we should dismiss declining NAEP scores or corresponding declines in student achievement on state tests. These measuring instruments have real value and help provide a check on grades and other student outcomes being reported by schools and teachers. And signs are pretty clear that more robust efforts to boost student achievement are needed.
The GAO issued a somewhat scathing report in January on state and school districts’ efforts, or lack thereof, to turn around the nation’s lowest performing schools. The majority of states don’t even follow the basic guidelines under federal law such as ensuring that turnaround plans include a needs assessment, an analysis of resource inequities, and evidence-based intervention policies. The GAO asked the U.S. Department of Education to step up monitoring and oversight of school improvement plans, but the Feds can’t do it on their own. We need leaders at all levels of government to return to, and go above and beyond, the days when student achievement was trending in a positive direction and ensure that every student who graduates with a high school diploma is fully prepared for college, the job market, and citizenship.