Overview
The Massachusetts Business Alliance for Education (MBAE) recently released some troubling analyses on inequities in per-pupil funding between high- and low-poverty schools in Boston and throughout the state. These results are based on new reporting required under the Every Student Succeeds Act (ESSA) that reflects real budget and spending for each individual school, a departure from the use of misleading district-wide averages used by most states and local education agencies prior to ESSA. Massachusetts is one of the first states to report such data out under these new ESSA requirements.
As part of our national research into this new ESSA-required data, we have been conducting similar analyses and can confirm MBAE’s findings. We also uncovered even larger inequities between schools with high and low concentrations of non-white students. This is likely not an aberration – we expect a national trend in school funding inequities as states and districts begin to report school level expenditures.
To bring this disparity to life, we focused on Massachusetts’ capital city. In Boston Public Schools (BPS), schools with the highest concentrations of students of color receive an average of $1,033 less per student than schools with the lowest concentrations of students of color. Within this trend, we also find wide variations in funding, suggesting the absence of a comprehensive strategy to provide students of color with equitable levels of funding.
National Background
School funding inequities between districts is a perennial problem in education policy. Report after report has reached the same conclusion: those students who most need the resources necessary for a high-quality education attend schools in districts that receive significantly less in per-pupil funding then do their more advantaged peers.
What’s less known and less discussed is that there are also within-district inequities that follow along the same lines of—and exacerbate—those between districts. In fact, a 2012 study by the Center for American Progress concluded that: “approximately 40 percent of variation in per-pupil spending occurs within school districts.”
Nationally, two key reasons for within-district inequities are that, in most districts, teachers with more seniority: 1) Are paid more than less experienced teachers; and, 2) Get preferential choice aka “bumping” rights in where they teach. This, in turn, means a greater concentration of more senior and higher-paid teachers at schools with less challenging student populations (i.e., those with low concentrations of students of color and those from low-income families) and, conversely, a higher concentration of less experienced and therefore less well-paid teachers at schools with high concentrations of low-income and minority students.
Preliminary Findings
Using data from the BPS 2019-2020 school year budget,[i] we find:
In terms of total per pupil spending, the 25% of BPS schools with the highest concentration of students of color (91-99%) will receive an average of $1,033 less per student than the 25% of schools with the lowest percentage of students of color (20%-66%). That equates to a difference of $18,594 per class of 18 students.[ii]
Looking just at spending on teachers and paraprofessionals[iii] we found that:
The 25% of BPS with the highest concentration of students of color (91%+) spend an average of $270 less per pupil on teacher and paraprofessionals than the 25% of schools with the lowest concentrations of students of color (20-66%), or $4,860 per class of 18 students. This suggests that BPS reflects nationwide trends of inequitable distribution of teachers, with students of color exposed to less experienced teachers than their white peers across the district.
Using data from the Massachusetts state reporting system[iv], we find similar trends to the 2019-20 budget. In 2018:
Schools with higher concentrations of students of color spent slightly less per student than schools with lower concentrations of students of color. The 25% of schools with the highest percentages of students of color spent an average of $241 less per pupil than the 25% of schools with the lowest concentrations of students of color, or $4,338 per class of 18.
Beyond the inequity trends, it seems like because there are so many different funding streams that determine each school’s per-pupil funding total, there are big winners and big losers that don’t cohere in any logical, policy-driven way, as the scatterplot below shows. We see no good reason why 15% of schools with 75% or more non-white students get per-pupil funding of less than $20,000 per student, while so many other schools receive per-pupil funding of $25,000 – $30,000.

Winners in this system share few characteristics. Schools with over $30,000 in per pupil funding have between 40% and 95% students of color, 45% to 92% economically disadvantaged students, comprise all grade levels, include both specialized/alternative schools and traditional neighborhood schools, and are in neighborhoods across the city. And there is a similar range of characteristics among schools that receive fewer than $20,000 per student.
Ultimately, current funding structures—which in includes policy-driven allocations related to enrollments and teacher collective bargaining agreements as well as more random allocations such as supplies or technologies expenses—works to undermine policies designed to provide more resources for students that need them, leaving students of color with fewer resources than their white peers.
[i]Analyses use financial data from the BPS 2019-20 budget and enrollment data from Massachusetts Department of Elementary and Secondary Education. We omitted schools that BPS noted use a different funding formula and school that were not present in both datasets. We looked at both the per pupil amount just from the weighted student formula and the total per pupil allocations, including support and central administration allocations.
[ii]The average class size in Boston is 18 students. See: https://www.bostonpublicschools.org/cms/lib/MA01906464/Centricity/Domain/187/BPS%20at%20a%20Glance%202017-2018.pdf
[iii]Spending figures reported by BPS are projections for the 2019-20 school year, and therefore totals match school budget allocations. Actual spending may ultimately differ from estimates.
[iv]In compliance with ESSA, Massachusetts Department of Elementary and Secondary Education publishes total per pupil spending in each school in the state as a part of school report cards. However, not data on how this money is spent is available.
To me, one finding from our recent deep dive into Massachusetts public higher education has been particularly shocking. Bay State students of color are much more likely to attend a community college than the national average and much less likely to complete their degrees.
Massachusetts Black high school graduates are 50 percent more likely, and Latino graduates are nearly twice as likely as their white peers to attend an in-state community college. Yet, Black students are 54 percent less likely than their white peers to complete and Latino students are 48 percent less likely to complete an associate’s degree program within 3 years. And that’s for first-time, full-time students. Completion rates are typically much, much worse for part-time students and non-first-time students.
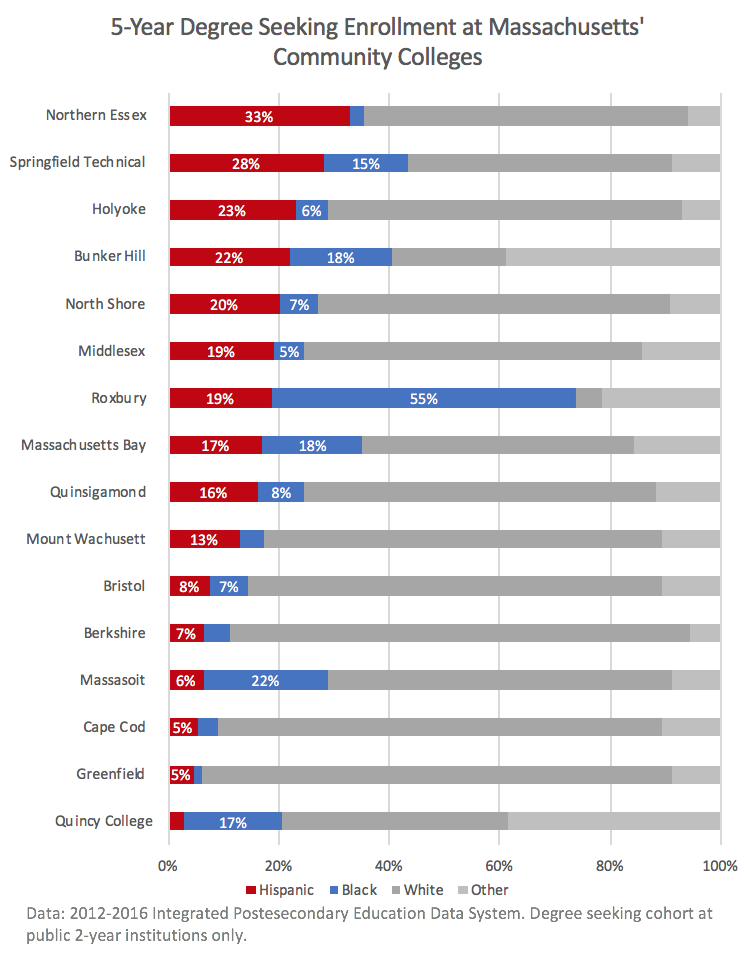
The following chart captures the racial and ethnic composition of the degree-seeking cohort by combining data from the past five years (to increase sample sizes). As is evident, different schools serve different populations, but perhaps the most important thing to recognize is how disproportionately represented students of color are, overall.
A look at the five-year average of Massachusetts’ 18-24 year-old (“college age”) population finds only 9 percent of the state’s population is Black and only 14.3 percent of the state’s population is Hispanic or Latino. Yet, when one examines Bunker Hill Community College enrollment, for example, there are over twice as many Black students, and over one-and-a-half times as many Latino students as would be representative of the state’s college-age population,

Moreover, in general, the completion rates at these community colleges are poor. Only one of these community colleges has an overall first-time, full-time degree seeking student 3-year completion rate over 25 percent — Greenfield, at 26 percent. Unfortunately, Greenfield also had the lowest enrollment rates of Black (1 percent) and Latino students (5 percent). It might as well be in Vermont.
When one looks specifically at Massachusetts’ community college Black student 3-year completion rates, no institution has a success rate above 15 percent, and for Latino completion rates, the only institution to average above 20 percent was Berkshire Community College, at 22 percent.
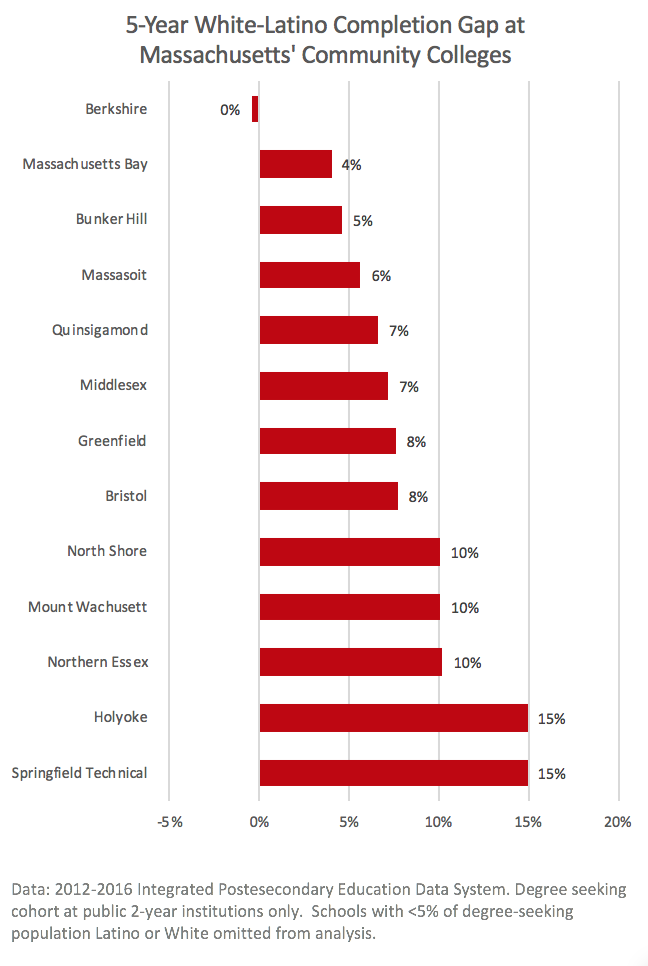
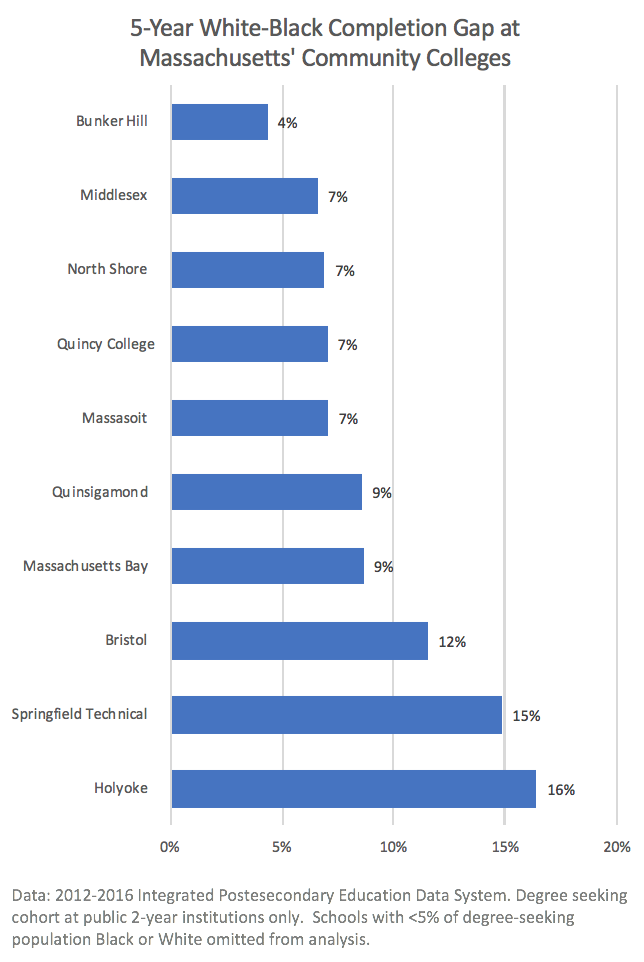
Worse still are the completion gaps facing students of color across these institutions. The charts (below) illustrate the 5-year graduation gaps between students of color and their white peers. From our analysis, it is clear that some institutions work and are more successful in closing their gaps better than others. One concerning actor is Springfield Technical Community College – which has one of the highest overall completion rates (still only 20 percent), one of the highest proportions of enrolled students of color, and yet also has some of the largest gaps between white students and their Black and Latino peers – both gaps are 15 percentage points wide. Put another way, despite high overall completion rates, a Black or Latino student at is less than half as likely as a white student to graduate from Springfield Technical.


So, what can communities and colleges do to close gaps and raise overall completion rates? Well, the single greatest predictor of college success is academic preparation. To get better results, we recommend making the MassCore college preparatory track the default track for every student, and crucially, also provide high schools and non-profit community-based organizations additional resources to provide academic support for those students who are behind. That means everything from one-on-one tutors to extended learning time during the year and over the summer. Massachusetts has a history of raising standards and providing additional aid for extra support to boost achievement. It needs to double down on that strategy in high schools.
We also recommend providing targeted state resources to community colleges and non-profits in order to provide proven supports like counseling, child-care, and transportation aid for struggling students. In return, we suggest that institutions need to be held more responsible to governments and accrediting agencies for their gaps in access and outcomes. If we give institutions additional resources to provide better services and close equity gaps, then we expect those resources to be put to good use or risk consequences ranging from altered institution leadership to repayment (potentially with interest).
# # #
For a more detailed discussion of these policy proposals, and our comprehensive college promise plan for Massachusetts, please see our recently released report: No Commencement in the Commonwealth: How Massachusetts’ Higher Education System Undermines Economic Mobility for Latinos and Others – And What We Can Do About It.