
Last week, we focused on ED’s failure to enforce ESSA guardrails that quite sensibly require state accountability system indicators be comparable and statewide. A second set of equally sensible and necessary ESSA requirements – that ED has also chosen to ignore – stipulates that all state accountability systems incorporate student proficiency on annual state assessments in math and English Language Arts (ELA). As you can see from our summary of ESSA “bright line,” statutory provisions, proficiency is a required accountability system indicator, both for all students and for groups of historically disadvantaged students, as are goals for closing proficiency gaps between the latter groups of students and their more advantaged peers.
Unlike its predecessor, No Child Left Behind (NCLB), ESSA allows states to include in their accountability systems, in addition to proficiency rates, other indices derived from state assessments. These include changes in scale score averages over time, i.e., what is typically referred to as student “growth” or “progress.” We think that this is a significant improvement over NCLB. The problem is that some states want to use only scale scores and abandon proficiency, or any other achievement benchmarks, altogether.
See also: ED’s Failure to Enforce ESSA Will Hurt Students – Part 1
As we’ve discussed previously, Connecticut is one state that sought to rely exclusively on average test scores without considering how many students are meeting college and career-ready benchmarks. Peer reviewers at ED, to their credit, did cite Connecticut’s state plan for being non-compliant:
ESEA requires a State to measure and describe in its State plan an Academic Achievement indicator that is based on grade-level proficiency on statewide assessments in reading/language arts and mathematics. In its State plan, CSDE does not describe how it calculates an Academic Achievement indicator based on proficiency, inconsistent with the statutory requirements.
ED letter to Dianna R. Wentzell, Commissioner of the Connecticut State Education Department, June 30, 2017
In response, Connecticut absurdly claimed that the dictionary definition of proficient includes “an advancement in knowledge or skill.” In the world of education policy, at least that outside of the Nutmeg State, “advancement in knowledge or skill” is known almost universally as “growth” or “progress.” This distinction was made famous in an exchange between Senator Al Franken and Secretary Betsy DeVos at the latter’s primetime HELP Committee confirmation hearing that was also parodied on Saturday Night Live (29,765,954 YouTube views, at the moment, and counting). This makes the proficiency versus growth distinction the most discussed point of education wonkery in the mainstream media for the entire year. Nonetheless, ED ignored peer reviewers, accepted Connecticut’s tortured logic, and approved Connecticut’s ESSA plan without change on this point.
Connecticut sets the “ultimate target” on its assessment index at 75 by end of 2030. The plan makes the misleading claim that “schools with index scores of 75 or better have around 70 percent or greater of their students at or above the threshold score for the desired achievement level.” Averages, however, cannot tell you anything about the dispersal (or, in statistical terms, “variance”) of scores. By definition, it’s impossible to know from an average scale score alone how many students in any school are at what Connecticut calls the “desired achievement level” or, for that matter, at any other point on the scale.
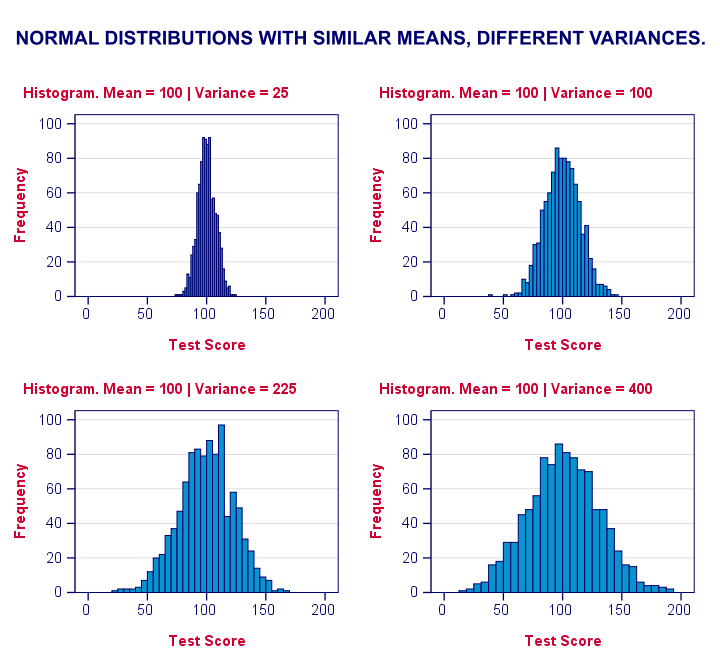
This is Stats 101. The above chart – hat tip SPSS – shows just four (of thousands of possible) dispersal patterns for test scores, with the average score equal to 100. Even though most scores in all four charts are clustered toward the average, the four scenarios vary greatly in the number of students scoring on the lower and higher ends. In the first chart, no student falls below about 75 or above about 125. In the last chart, many students fall above and below those benchmarks.
These 4 are merely the types of patterns one would see in what is referred to, in statistical terms, as a “normal distribution.” An average score can also reflect a scenario where: half of students are well above the average (say top 25%) and the other half well below it (say bottom 25%); or a subset of students is clustered at the highest level (say top 10%) while the rest are evenly dispersed between that cut off and the lowest possible score. There are numerous other possibilities, each of which comprises very different levels of achievement for individual students.
Keep in mind that those arguing for the use of scale scores – and scale scores only – are doing so in part based on their belief – supported by some but not all research – that schools will pursue dubious methods, such as focusing only on students within a particular range of achievement, in order to, with the least amount of effort, reach the goal that the state expects of them. What these advocates seemingly fail to realize is that the use of scale scores alone can drive the same types of perverse incentives, i.e., those aimed at manipulating averages by boosting the scores of students at higher rather than lower levels of achievement. Using proficiency rates and scale scores together – plus, as some have wisely recommended, a focus on boosting the bottom 25% of students – is a good way to make those bad practices less likely.
Colorado’s plan, the last plan from Round 1 yet to be approved by ED, also proposes the use of scale scores without consideration of proficiency rates. We are hopeful that ED corrects course on this issue and works with advocates on the ground to help the Colorado Department of Education to come up with a plan that focuses attention, as the law requires, on all students.
More on ESSA from ERN: here