Social Pressure RCT
- Education Reform Now implemented an experiment to test the ability of social pressure GOTV text messaging to increase the turnout of eligible voters in the CT Primary, held on Aug 11, 2020.
- The full universe comprised approximately 198,000 registered in CT who did not vote in the 2018 Primary and registered before Jan 1, 2018. We split this universe into 50/50 treatment/control groups.
- As of Monday, Oct 19, 2020, this vote history only contains partial results:
- 89% of total vote counts
- Overall turnout for the election was 31.2%
- Among the experimental group (given the universe was filtered to be on non-2018 primary voters), turnout was 19.3% in the control group, and 20.3% in the treatment group
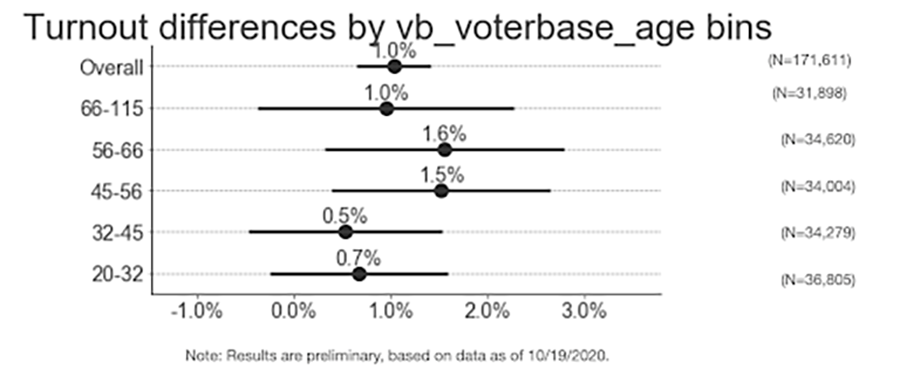
- This turnout difference of 1.0 percentage points is both statistically significant and large in magnitude
- The outreach showed greater impact with suburban voters and middle-aged voters (44-66), given the data we have thus far
- Very low turnout-propensity voters showed smaller impact (Presidential Primary turnout scores of 5 or below)
- Looking across race/ethnicity we need more data to determine impact in order to conclusively detect differences in impact

VBM Preliminary Results
- Overall Turnout/VBM Analysis
- Independent of the RCT, we’ve also used the (incomplete) individual election data we have thus far to examine characteristics of voters in the 2020 Primary:
- Which groups voted at higher/lower rates, relative to previous primaries
- Which groups were likelier to both turnout and vote-by-mail
- We display full results below across a range of demographics, indicating the likelihood of someone voting (or voting by mail), relative to the baseline probability that someone voted, given demographic characteristics about them.
- In other words – in the figure below, the dotted line represents the baseline probability that voters in that group vote (e.g. knowing that someone is in the 25-35 year age group indicates they were approximately 10 percentage points less likely to vote relative to the overall turnout rate, but it is still represented as “1.0” as marked by the dotted line)
- Looking across demographic groups we see the following patterns:
- Previous primary voters (and previous voters) were more likely to turnout
- Turnout was lower among less-educated voters relative to higher-educated voters
- Male/Unknown gender turned out at lower rates relative to Female
- Turnout was lower among Latinx voters
- For Age, we likely need more data to conclusively say, but it looks like 25-55 age groups turned out at lower rates than both 18-24 and 55+
- Independent of the RCT, we’ve also used the (incomplete) individual election data we have thus far to examine characteristics of voters in the 2020 Primary:

-
-
-
- The chart below shows similar results, except where we are predicting the likelihood that someone both 1) voted and 2) voted by mail/absentee
- Broadly speaking, many of the same demographic trends from above held also (with respect to past voting behavior, education, gender, race, and age)
- The chart below shows similar results, except where we are predicting the likelihood that someone both 1) voted and 2) voted by mail/absentee
-
-
