Author: Cody L. Christensen
Policymakers are increasingly interested in holding higher education programs accountable for the earnings of their former students. One of the latest examples comes from Senator John Cornyn (R-TX), who recently introduced legislation that would sanction master’s degree programs if the typical income of former students failed to meet certain earnings thresholds.
The intended goal of accountability policies like this one is to shut down low-quality graduate programs. The intent is good, but any plan like this must reckon with the fact that using earnings to measure program quality is inherently fraught with complications. A master’s degree program where many former students have low earnings may indeed reflect that the program is low quality, but programs with low earnings may also reflect that certain master’s degree programs serve disproportionately large groups of students from historically disadvantaged backgrounds. Said differently, some programs may have low earnings not because of what they do but because they enroll large shares of students who face unique challenges in the labor market. Those challenges are often outside of the college’s control, so it would seem unfair to punish colleges for them.
The trick is to design an accountability policy that distinguishes between programs that are legitimately of low quality – i.e., programs that offer little educational value, mismanage resources, and provide few supports career for students – versus programs that are of fine quality but serve disproportionately large shares of students from historically disadvantaged backgrounds who may face broader challenges in the economy. Below, I sketch how policymakers might design an accountability policy that more appropriately judges program quality, thereby protecting students and taxpayers alike.
Which types of Master’s Degree Programs would Fail an Earnings-based Accountability Test?
In a recent Urban Institute essay, I modeled how an earnings-based accountability test would impact master’s degree programs and students. The specific earnings test I modeled loosely resembled the one recently proposed by Sen. Cornyn. Under this test, a master’s degree program would “pass” if its typical graduate earns more than the average bachelor’s degree-holder in the same field of study living in the same state, after also netting out the average out-of-pocket cost to attend the master’s program1. See the textbox, below, for an example of how this earnings test is calculated.

I found that roughly three in ten master’s degree programs would fail such a test. Further, I found that failing programs serve disproportionately larger shares of female, black, and Hispanic students. Even after accounting for a wide swath of observable program and college characteristics, the programs that served larger concentrations of black and female students continued to fail the accountability test at higher rates than otherwise similar programs with smaller shares of students from these populations.2
These findings imply that earnings-based accountability tests could inadvertently target master’s degree programs that serve larger shares of students from historically disadvantaged backgrounds. Such an outcome could undermine the perceived fairness of the accountability policy and would come at the cost of reducing graduate school access for female, Black, and Hispanic students.
Designing a Better-Targeted Accountability Policy
A better-designed accountability policy would compare the earnings outcomes of programs with similar characteristics – such as programs in the same field of study with similar endowment sizes, geographic locations, and that generally serve similar students with similar demographic characteristics. Under this idea, all of the observable information about a program would be used to estimate what the program’s expected earnings outcomes would be based on its unique combination of characteristics and students. Then, you compare the actual earnings outcomes to the predicted earnings outcomes.
A concrete example helps clarify how the policy would work. Consider the University of Georgia’s master’s degree program in Human Resources Management. According to my analysis, graduates of this program typically earn $7,500 less per year than bachelor’s degree-holders in the same field of study that live in Georgia.3 Since the earnings premium is negative, this program would theoretically be subject to sanction under accountability proposals such as Sen. Cornyn’s legislation. However, after factoring in the program’s inputs – such as its field of study, location, and the above-average share of students in the program from historically disadvantaged racial/ethnic backgrounds – the graduates from this program actually earn roughly $8,200 more per year than what these graduates were predicted to earn after accounting for all of the program’s inputs.
Using the same data from the Urban Institute essay, I compare the earnings premiums for all master’s degree programs to the amount that each program would be predicted to earn based on the observable characteristics of the program.4 This comparison is shown in Figure 1.5 The y-axis measures how far above or below the program’s actual earnings premium is relative to the program’s predicted earning premium. Positive values on the y-axis imply that the program outperformed what was expected of it after accounting for its program characteristics, whereas negative values imply the opposite. The University of Georgia’s master’s in Human Resources Management program (described above) falls into the top left quadrant (purple) – it is a program that has negative earnings premiums, but after accounting for its program characteristics and student populations, it overperforms what was expected of it.
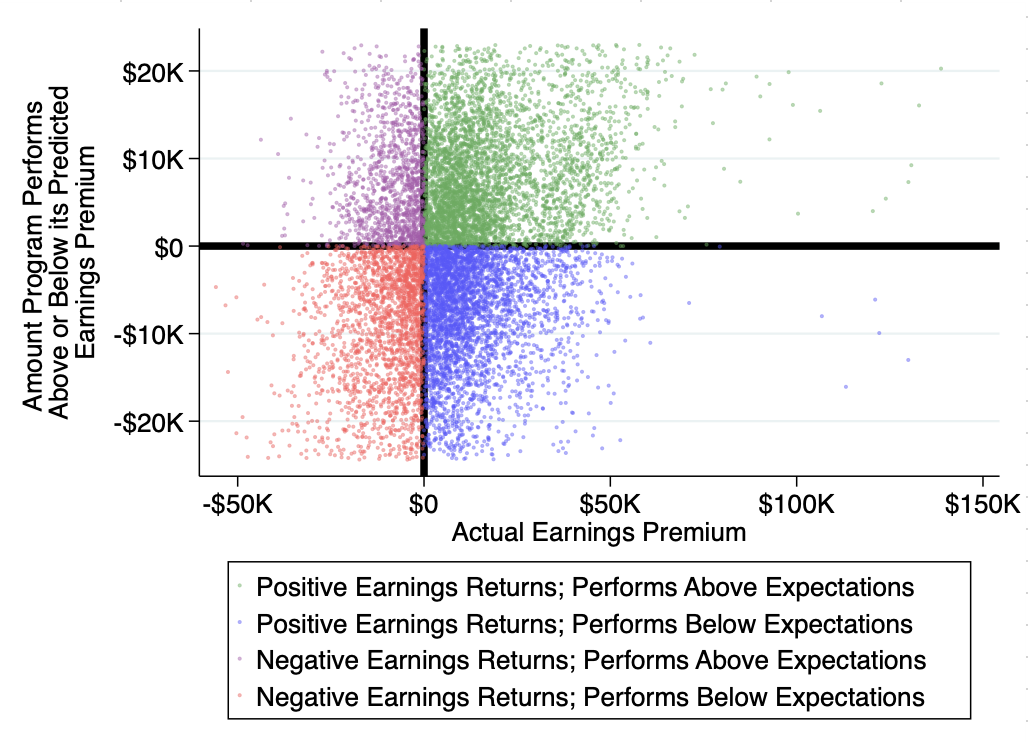
Source: Author’s calculations using IPEDS and College Scorecard data.
Note: Each dot represents a master’s degree program that operated for at least one year between 2014 and 2019. “Actual Earnings Premium” refers to the program’s Earnings Premium, as calculated and defined in Christensen, C. (2023) “Unintended Consequences of an Earnings-Based Accountability Test for Master’s Degree Programs” (Urban Institute). The Y-axis plots the residuals from the regression specified in Appendix D of the same report. Programs with Earnings Premiums in the top and bottom five percentiles are not shown. All values are in constant 2016 dollars adjusted using CPI.
Targeting Sanctions to a Narrow Set of Low-Earning Programs
Under this type of accountability policy, programs in the bottom left quadrant (the programs marked by red dots) should attract special attention from policymakers. These master’s degree programs leave their typical graduate with a negative earnings premium, on average. Even worse, these programs performed even worse than what would be expected of them when accounting for their field of study, location, institutional characteristics, spending patterns, and types of students in the program.
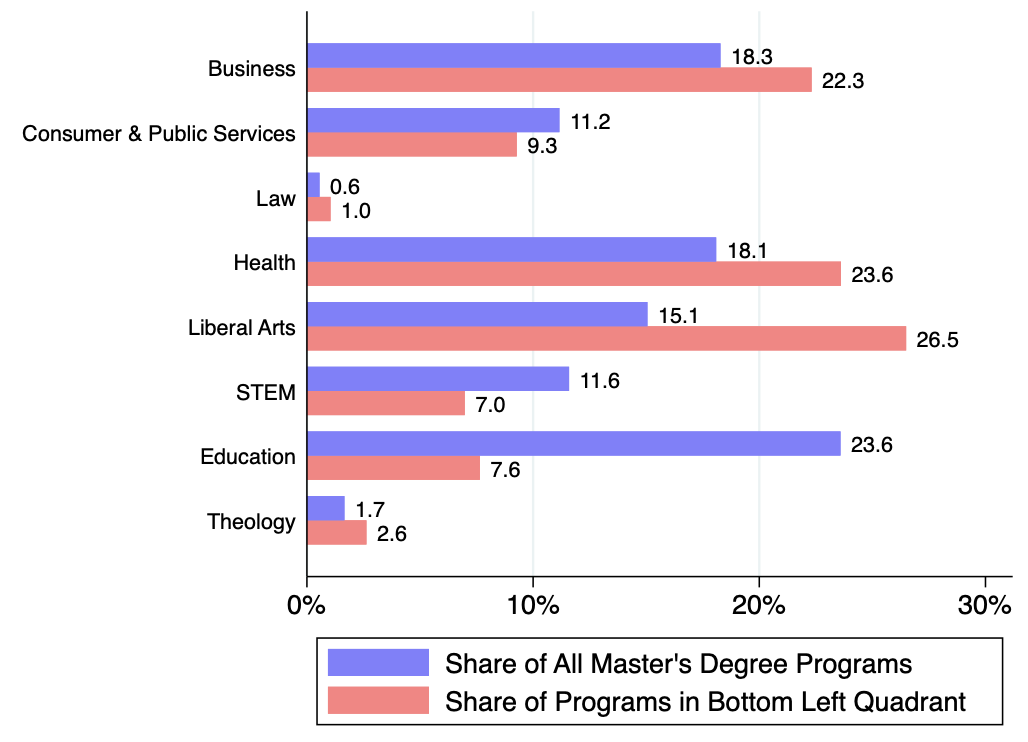
Source: Author’s calculations using IPEDS and College Scorecard data.
Note: Programs are defined at the two-digit CIP code level and classified into one of eight broad fields of study following Christensen (2023). The blue bars plot the frequency distribution of all master’s degree programs by broad field of study. The red bars plot the frequency distribution of master’s degree programs that are in the bottom left quadrant of Figure 1.
What type of programs fall into this quadrant? Figure 2 displays the frequency distribution of master’s degree by field of study nationally and also among only the programs in the bottom left quadrant. Comparing the blue and red bars reveals which program types are over-represented in the bottom left quadrant. Relative to the overall share of master’s degree programs in the country, these programs are more likely to be in Business, Health, and Liberal Arts. These programs are less likely to be in Consumer and Public service fields, STEM fields, and Education fields.
• Which Programs Most Outperform Expectations
• Which Programs Most Underperform Expectations
Conclusion
In the end, policymakers should be aware that using earnings thresholds for accountability policies could inadvertently treat some master’s degree programs unfairly. That is because certain programs serve disproportionately large concentrations of students from historically disadvantaged backgrounds, and these students may face unique and unpredictable challenges in the labor market. Given this challenge, policymakers should consider accounting for the different characteristics of master’s degree programs by comparing programs with similar characteristics against each other.
- See Appendix A in Christensen, C. (2023) “Unintended Consequences of an Earnings-Based Accountability Test for Master’s Degree Programs” for a full explanation of how the earnings test is computed and for a description of the data that are used to model this analysis. ↩︎
- This analysis is modeled in Appendix D in in Christensen, C. (2023) “Unintended Consequences of an Earnings-Based Accountability Test for Master’s Degree Programs” ↩︎
- All monetary values are in constant 2016 dollars adjusted using the CPI. ↩︎
- See Appendix D in Christensen, C. (2023) “Unintended Consequences of an Earnings-Based Accountability Test for Master’s Degree Programs” for the regression model used to generate these predicted values. In short, I control for observable student characteristics, institutional characteristics, field of study, and geographic location. ↩︎
- There are several potential limitations to this analysis. Most importantly, the analysis may be sensitive to the function form of the regression used to generate the predicted values. In addition, failing to account for unobserved program level factors or characteristics could influence predicted values, potentially resulting in some programs being misjudged. ↩︎
About the Author
Cody L. Christensen is a doctoral student in Higher Education Policy at Vanderbilt University.
See Appendix A and D of “Unintended Consequences of an Earnings-Based Accountability Test for Master’s Degree Programs” for additional details on the data, methods, sample. Data used to produce figures from this article are available from the author (cody.christensen@vanderbilt.edu) upon request.