In our previous post, Michael Dannenberg and I noted that students who complete their bachelor’s degrees at public universities in five or six years instead of the regular four are costing themselves, their states, and their institutions, over $5 billion per year.
But these costs are not distributed evenly among the states. Of course, the greatest predictor of spending of total costs is the number of students at issue, but once one controls for student population, the amount students, states, and institutions are spending on higher education are based on several factors:
- Slow Completion Rates – If students are completing at a slower than optimal rate, the amount being spent increases.
- High College Prices – Even if overall completion rates are better than other states, high college tuition, fees, or room and board will still drive up the cost.
- Level of State Aid – If a state does not provide much aid, student costs will be higher. If a state provides more aid, then the overall cost to the state will be higher. Both student and state costs will be higher if many students are completing in five or six years.
- Level of Institutional Aid – Precisely the same story as state aid.
The following graphics provide direct comparisons among the states on how much students, institutions, and states themselves, spend (often unnecessarily) due to slow completion — controlled for the size of the overall student population:
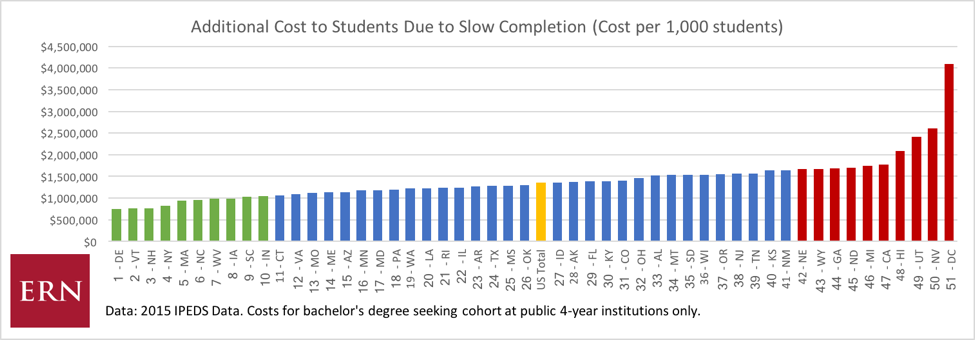
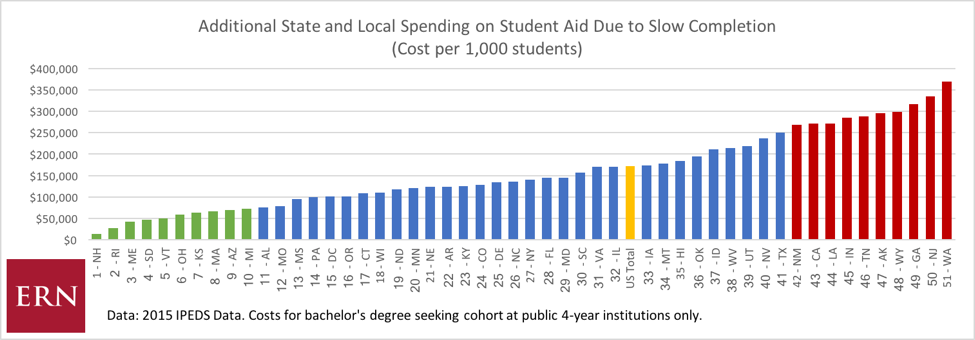
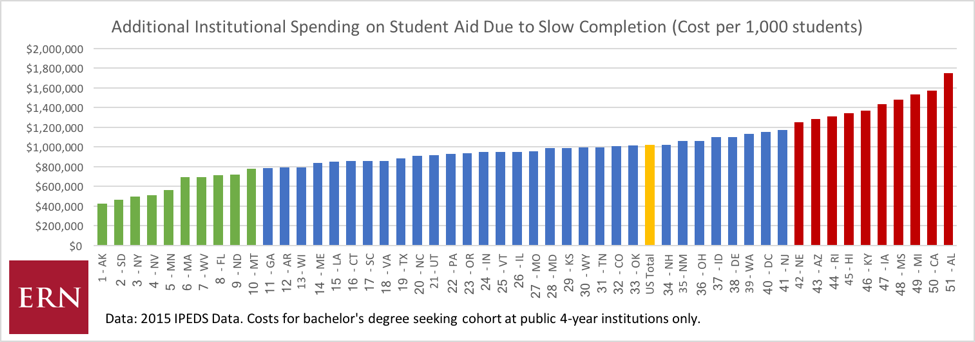
One notable stand-out in these charts is California, which finds itself among the ten states spending the most across all three categories, despite controlling for population size. This is likely because over 30 percent of California’s full-time first-enrollment bachelor’s degree seekers graduate in their fifth or sixth year. Furthermore, California’s average total cost of attendance is the fourth highest in the nation, driving up the bill for everyone.
Georgia, Nebraska, and Wyoming are among the ten states spending the most in two out of three categories. Much like California, these states all have high proportions of their graduates finishing late. Indeed, in all of these states, over one-quarter of students, who complete a bachelor’s degree program, finish in their fifth or sixth year, rather than at the end of their fourth. With such high proportions of students finishing late, the costs stack up quickly.
Improving completion rates is not an easy task, and it begins well before college. States need to invest in increasing access to college preparatory tracks in high school, and make those tracks more rigorous so that students don’t waste time taking remedial coursework in college on their own dime. They and institutions of higher education themselves need to invest in the resources students need to succeed in college on time – better advising, scheduling, and counseling, so that students know which classes to take and when in order to complete on time. And finally, they need to work to make college more affordable, so that students can focus on coursework, rather than a full-time job. Surely every state can see the benefit from students graduating earlier and pumping the tax dollars from a $50,000+ job back into their coffers.
For the states at the bottom of these lists, improving college completion rates will take significant investment – but this data illustrates that the juice is worth the squeeze.